Example configurations
Replacing Munin
The first step is to create a TRIG stack (Tensor Riemann InfluxDB Grafana).
Step 1: Install Riemann
$ wget http://aphyr.com/riemann/riemann_0.2.6_all.deb
$ aptitude install openjdk-7-jre
$ dpkg -i riemann_0.2.6_all.deb
Step 2: Install InfluxDB
$ wget http://s3.amazonaws.com/influxdb/influxdb_latest_amd64.deb
$ sudo dpkg -i influxdb_latest_amd64.deb
Start InfluxDB, then quickly change the root/root default password because it also defaults to listening on all interfaces and apparently this is not important enough for them to fix.
Create a riemann and grafana database, and some users for them
$ curl -X POST 'http://localhost:8086/db?u=root&p=root' \
  -d '{"name": "riemann"}'
$ curl -X POST 'http://localhost:8086/db?u=root&p=root' \
  -d '{"name": "grafana"}'
$ curl -X POST 'http://localhost:8086/db/riemann/users?u=root&p=root' \
  -d '{"name": "riemann", "password": "riemann"}'
$ curl -X POST 'http://localhost:8086/db/grafana/users?u=root&p=root' \
  -d '{"name": "grafana", "password": "grafana"}'
NB. InfluxDB is easy to get running but is not production ready or stable so your data can very easily be lost.
Step 3: Install Grafana
$ aptitude install nginx
$ mkdir /var/www
$ cd /var/www
$ wget http://grafanarel.s3.amazonaws.com/grafana-1.8.1.tar.gz
$ tar -zxf grafana-1.8.1.tar.gz
$ mv grafana-1.8.1 grafana
Now we must create an nginx configuration in /etc/nginx/sites-enabled.
You can use something like this
server {
    listen 80;
    server_name <your hostname>;
    access_log /var/log/nginx/grafana-access.log;
    error_log /var/log/nginx/grafana-error.log;

    location / {
        alias /var/www/grafana/;
        index index.html;
        try_files $uri $uri/ /index.html;
    }
}
Next we need a configuration file for grafana. Open /var/www/grafana/config.js and use the following configuration
define(['settings'],
function (Settings) {
  return new Settings({
    datasources: {
      influxdb: {
        type: 'influxdb',
        url: "http://<your hostname>:8086/db/riemann",
        username: 'riemann',
        password: 'riemann',
      },
      grafana: {
        type: 'influxdb',
        url: "http://<your hostname>:8086/db/grafana",
        username: 'grafana',
        password: 'grafana',
        grafanaDB: true
      },
    },
    search: {
      max_results: 20
    },
    default_route: '/dashboard/file/default.json',
    unsaved_changes_warning: true,
    playlist_timespan: "1m",
    admin: {
      password: ''
    },
    window_title_prefix: 'Grafana - ',
    plugins: {
      panels: [],
      dependencies: [],
    }
  });
});
Step 4: Glue things together
Lets start by configuring Riemann to talk to InfluxDB. This is the full /etc/riemann/riemann.config file.
; -*- mode: clojure; -*-
; vim: filetype=clojure
(require 'capacitor.core)
(require 'capacitor.async)
(require 'clojure.core.async)

(defn make-async-influxdb-client [opts]
    (let [client (capacitor.core/make-client opts)
          events-in (capacitor.async/make-chan)
          resp-out (capacitor.async/make-chan)]
        (capacitor.async/run! events-in resp-out client 100 10000)
        (fn [series payload]
            (let [p (merge payload {
                    :series series
                    :time   (* 1000 (:time payload)) ;; s → ms
                })]
                (clojure.core.async/put! events-in p)))))

(def influx (make-async-influxdb-client {
        :host     "localhost"
        :port     8086
        :username "riemann"
        :password "riemann"
        :db       "riemann"
    }))

(logging/init {:file "/var/log/riemann/riemann.log"})

; Listen on the local interface over TCP (5555), UDP (5555), and websockets
; (5556)
(let [host "0.0.0.0"]
  (tcp-server {:host host})
  (udp-server {:host host})
  (ws-server  {:host host}))

(periodically-expire 60)

(let [index (index)]
  (streams
        index

        (fn [event]
            (let [series (format "%s.%s" (:host event) (:service event))]
                (influx series {
                    :time  (:time event)
                    :value (:metric event)
                })))))
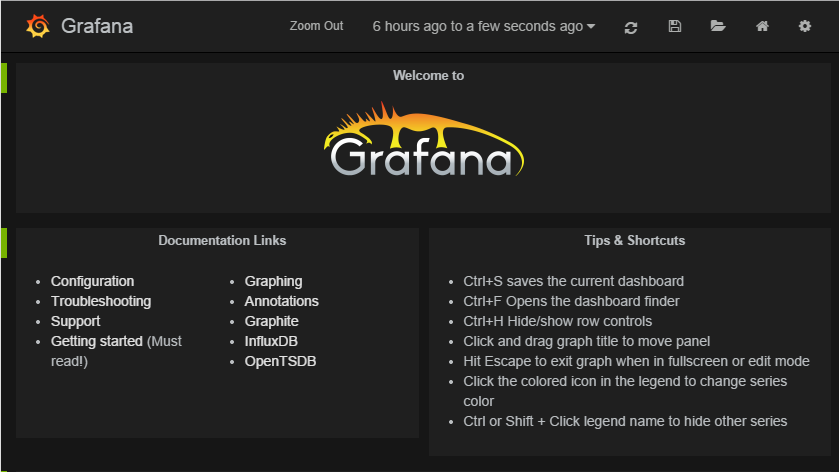
You’re pretty much done at this point, and should see the metrics from the Riemann server process if you open up Grafana and look through the query builder.
Step 5: Using Tensor to retrieve stats from munin-node
First of all, install Tensor
$ pip install tensor
Next create /etc/tensor and a tensor.yml file in that directory.
The tensor.yml config file should look like this
ttl: 60.0
interval: 1.0

outputs:
    - output: tensor.outputs.riemann.RiemannTCP
      port: 5555
      server: <riemann server>

# Sources
sources:
    - service: mymunin
      source: tensor.sources.munin.MuninNode
      interval: 60.0
      ttl: 120.0
      critical: {
        mymunin.system.load.load: "> 2"
      }
This configures Tensor to connect to the munin-node on the local machine and retrieve all configured plugin values. You can create critical alert levels by setting the dot separated prefix for the service name and munin plugin.
You can now start Tensor
$ twistd -n tensor -c /etc/tensor/tensor.yml
2014-10-22 13:30:38+0200 [-] Log opened.
2014-10-22 13:30:38+0200 [-] twistd 14.0.2 (/home/colin/riemann-tensor/ve/bin/python 2.7.6) starting up.
2014-10-22 13:30:38+0200 [-] reactor class: twisted.internet.epollreactor.EPollReactor.
2014-10-22 13:30:38+0200 [-] Starting factory <tensor.protocol.riemann.RiemannClientFactory instance at 0x7faeec021b90>
This pretty much indiciates everything is alright, or else we’d see quickly see some errors.
Next we will add some graphs to Grafana
Step 6: Creating graphs in Grafana
Click on the green row tag on the left, and delete all but the last row. This will leave you with an empty graph.
Click the title of the graph, then click Edit.
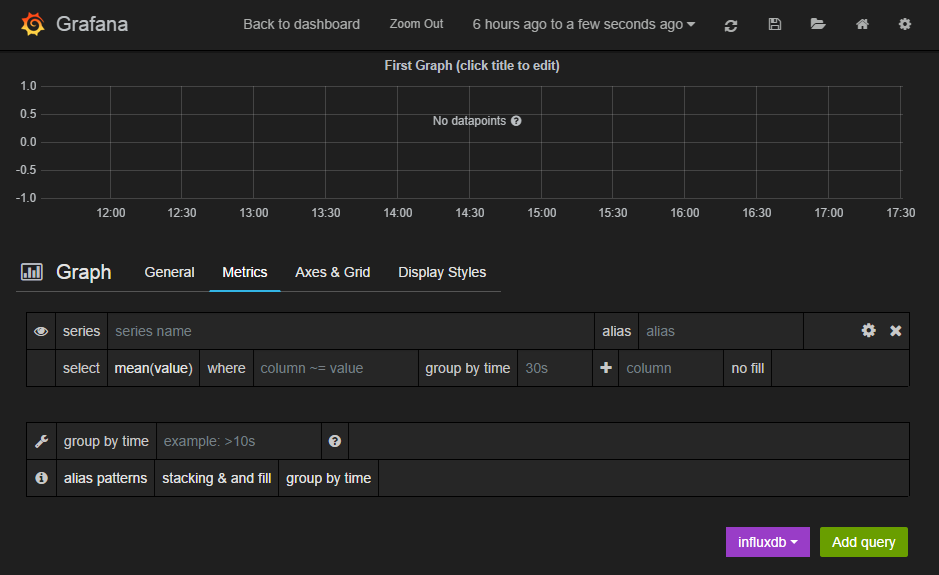
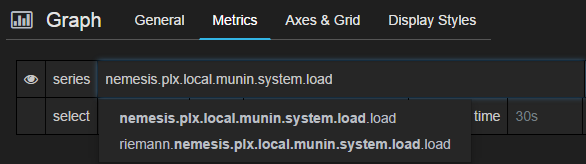
In the edit screen the Metrics tab will be open already. Now we can add our munin metrics. If you start typing in the series field you should see your hosts and metrics autocomplete.
Many Munin metrics are counter types which are usually converted to a rate by the RRD aggregation on Munin Graph.
Handily the tensor.sources.munin.MuninNode source takes care of this
by caching the metric between run intervals when that type is used.
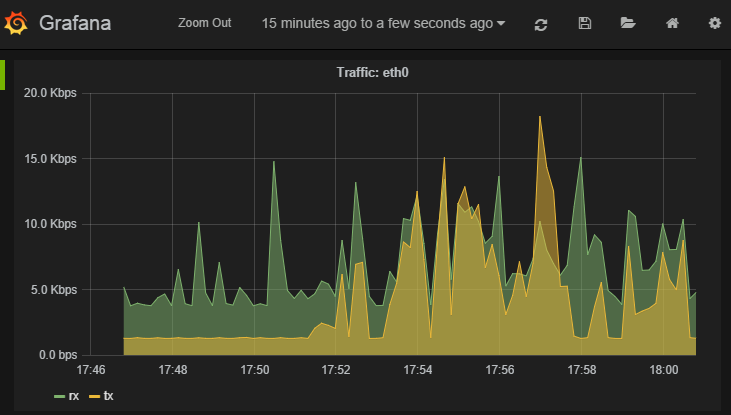
If we wanted to graph our network interface all we need to do is make it a slightly better unit by multiplying the Byte/sec metric by 8, since Grafana provides a bit/sec legend format.
To do this start by clicking the gear icon on the metric query, then select Raw query mode.
Use the following query
select value * 8 from "<your hostname>.munin.network.if_eth0.down" where $timeFilter group by time($interval) order asc
And chose an alias of “RX”. Do the same for if_eth0.up and alias that “TX”. You should end up with something like this
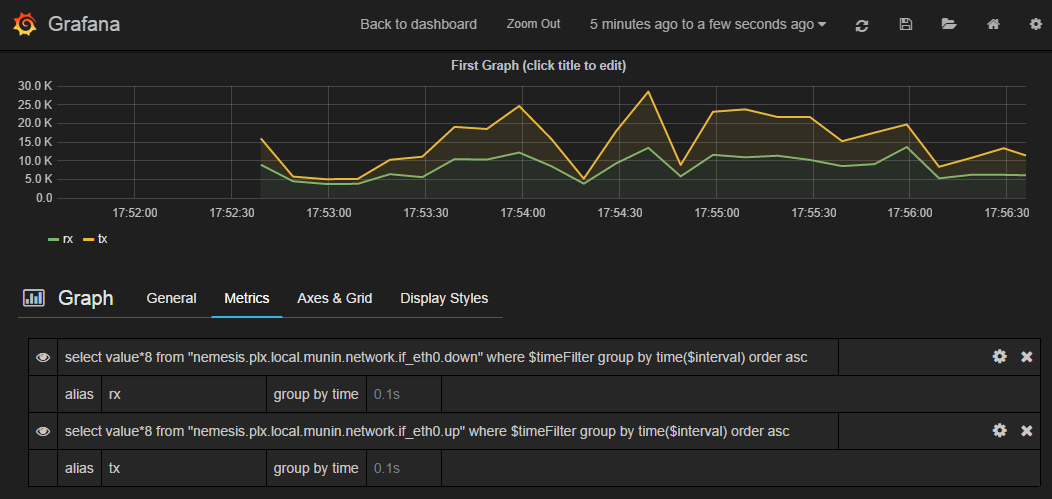
Click on General to edit the title, and then on Axes & Grid change the Format to bps. Under Display Styles you can stack the data or play around with the look of the graph. Click Back to dashboard and you should end up with something as follows